Chart
A bar, line, or candle chart.
A line with more points than the plot has pixel columns keeps the low and high point of each column, so 100k points draw as one short path. candles takes (open, high, low, close) rows. x_range binds the visible range in point units: the wheel zooms around the pointer and a drag pans. crosshair draws rules and the value under the pointer. A signal or closure source draws the chart again when it changes, like sparkline. The chart fills its parent's width unless .width() is set; at small heights it thins x-axis labels and hides the axis row before the plot gets too small.
GUITUIRuns in the browser
chartPreview
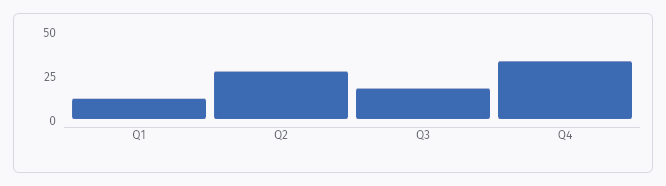
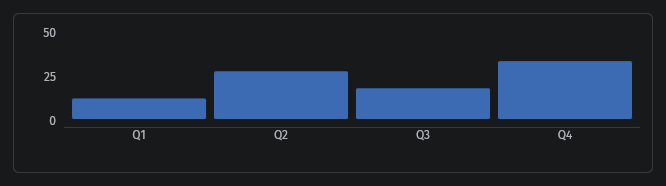
Usage example
fn chart_demo() -> ChartBuilder { chart([12.0, 28.0, 18.0, 34.0]) .labels(["Q1", "Q2", "Q3", "Q4"]) .height(160.0)}fn chart_demo() -> ChartBuilder { chart([12.0, 28.0, 18.0, 34.0]) .labels(["Q1", "Q2", "Q3", "Q4"]) .height(160.0)}API
| Name | Signature | Purpose |
|---|---|---|
chart | `fn chart(values: impl Reactive<Vec<f32>>) -> ChartBuilder`; `ChartBuilder::candles(rows: impl Reactive<Vec<(f32, f32, f32, f32)>>)`, `.x_range(Signal<Range<f32>>)`, `.crosshair()` | A bar, line, or candle chart. A line with more points than the plot has pixel columns keeps the low and high point of each column, so 100k points draw as one short path. candles takes (open, high, low, close) rows. x_range binds the visible range in point units: the wheel zooms around the pointer and a drag pans. crosshair draws rules and the value under the pointer. A signal or closure source draws the chart again when it changes, like sparkline. The chart fills its parent's width unless .width() is set; at small heights it thins x-axis labels and hides the axis row before the plot gets too small. |